Investors are closely monitoring global commodity markets this week, particularly focusing on five essential charts that provide valuable insights into the current trends. Here are the key points to consider:
Oil Options:
Despite a slight cooling in the rally of oil futures, investors are actively buying call options to protect against a potential spike in crude prices. The rising aggregate open interest for Brent call options indicates heightened concerns about the ongoing conflict in the Middle East.
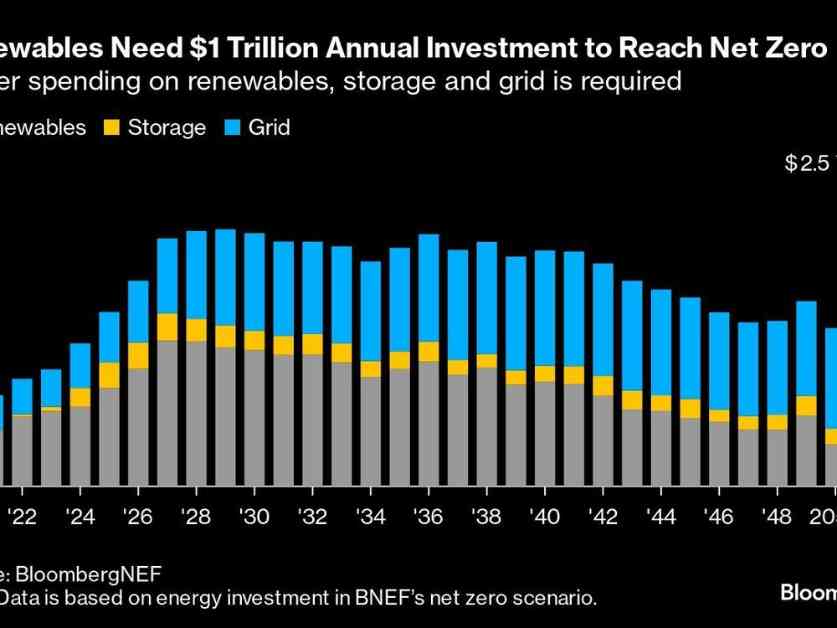
Renewables Spending:
Global spending on renewable energy, battery storage, and grid upgrades needs to accelerate to zero out greenhouse gas emissions by 2050. According to BloombergNEF, an average investment of $1 trillion per year in renewables is necessary between 2024 and 2030 to achieve this goal. Governments must take action to facilitate clean power development by removing fossil fuel subsidies and easing supply chains.
Palm Oil:
Tight supply conditions in top palm oil producers like Indonesia and Malaysia have driven palm oil futures to highs not seen since April. The aging trees and disruptions in the Middle East could further boost palm oil prices, which are currently at a premium compared to soybean oil.
Gold ETFs:
Investors are turning to gold ETFs as a safe-haven asset amid geopolitical and economic uncertainty. With gold prices surging over 25% this year, global holdings of physically backed gold funds have seen consistent growth. The precious metal’s performance has been supported by factors like low-interest rates and market volatility.
Milton & Gas:
Natural gas futures experienced a decline before and after Hurricane Milton, as the loss of electricity led to a drop in gas demand. Gas is a crucial energy source for power plants, and disruptions like hurricanes can impact its pricing and availability.
In conclusion, the global commodity markets are dynamic and influenced by various factors such as geopolitical tensions, supply disruptions, and economic conditions. Investors and traders are closely monitoring these essential charts to make informed decisions in a rapidly changing market environment.


