Oil supplies are increasing, leading to dropping prices and sparking discussions at the CERAWeek energy conference in Houston. Meanwhile, uncertainty in trade policies is causing concern over 11 million metric tons of US grains. In the midst of all this, gold miner earnings reveal shifts in market leadership. As we navigate through these complex global commodity markets, it is crucial to monitor key charts that provide insights into these dynamic industries.
Oil Production: A Game of Power and Price
In the ever-evolving landscape of global energy markets, President Donald Trump’s America has emerged as a dominant player, producing record-breaking barrels of oil daily. This unprecedented feat has granted the US significant influence, but the sustainability of this power remains uncertain. OPEC+ has recently agreed to ramp up production, causing oil prices to plummet below $70 per barrel, marking the lowest point this year. With such diminished prices, US shale drillers may opt to prioritize the preservation of future well locations over escalating production rates. This delicate balance of supply and demand underscores the intricate dance of oil production on the global stage.
Agriculture: Trade Tensions and Grain Gambles
The escalating trade tensions between major players like Mexico, Canada, and China are casting a shadow of uncertainty over the fate of 11 million metric tons of US grains. Traders are closely monitoring potential cancellations of grain contracts amidst the turmoil of tariffs and shifting trade policies. Of particular concern is Mexico, the largest buyer of US corn, which holds substantial contracted cargoes. Similarly, China and Canada have significant amounts of unshipped grains, adding further complexity to the volatile agricultural landscape. These developments highlight the interconnectedness of global trade and the ripple effects of policy decisions on commodity markets.
Gold: Mining Giants Battle for Supremacy
In the glittering world of gold mining, industry giants are vying for the top spot in the bullion market. Newmont Corp. solidified its position as the leading producer following its acquisition of Australia’s Newcrest Mining Ltd. in 2023. On the other hand, Barrick Gold Corp. faced setbacks, allowing Agnico Eagle Mines Ltd. to close in on its lead. The fate of Barrick’s Mali mine complex looms large as it could determine the balance of power in the competitive gold mining sector. These intricate dynamics underscore the fierce competition and strategic maneuvers within the gold market.
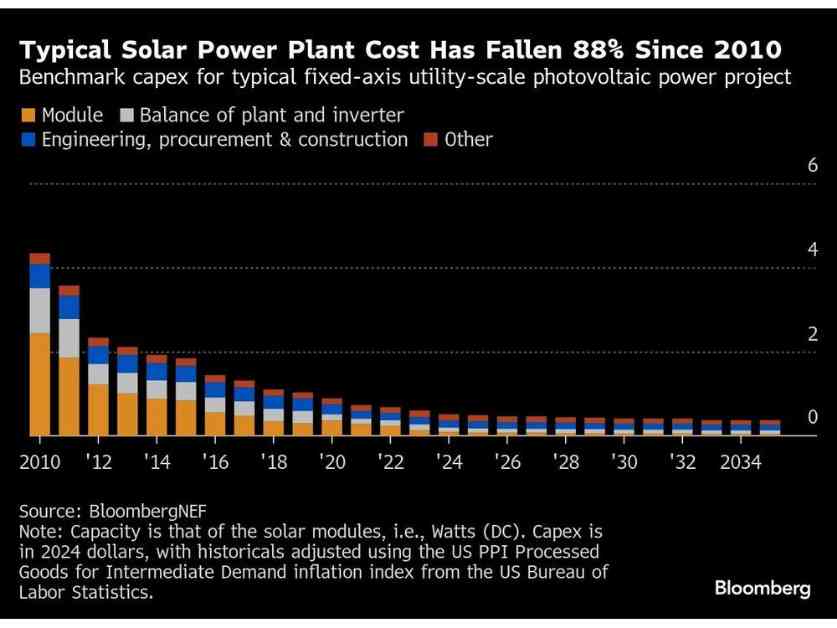
Solar: Bright Horizons Ahead
The solar industry is witnessing a significant transformation, with solar modules now costing only 40% of what they did at the end of 2022. This substantial price drop, coupled with rising efficiency levels, indicates a promising future for solar projects. BloombergNEF predicts a 27% reduction in overall costs for solar projects by 2035, reflecting the ongoing advancements in technology and the increasing accessibility of solar energy. As the solar landscape continues to evolve, these developments pave the way for a more sustainable and cost-effective energy future.
In conclusion, the global commodity markets are a dynamic tapestry of interconnected industries, influenced by a myriad of factors ranging from trade policies to production capacities. By closely monitoring key charts and trends in these markets, stakeholders can gain valuable insights into the shifting landscape of commodities. As we navigate through these turbulent waters, it is essential to remain vigilant, adaptable, and informed to make informed decisions in this ever-changing environment.


 – Final NAV Analysis and Performance Update")


